In the modern marketing landscape, having real-time data at your fingertips is crucial for driving decision-making. Forecasting dashboards for marketing campaigns provide invaluable insights into how your campaigns are performing and offer predictions to guide future strategy. Building a forecasting dashboard can be a game-changer for marketers, enabling them to plan effectively and optimize campaigns for maximum ROI. Here’s a guide on how to build a forecasting dashboard that helps you stay ahead of the curve.
1. Define Your Campaign Goals and Metrics:
Before jumping into the technicalities of dashboard creation, it’s important to define what you want to measure. For marketing campaigns, common KPIs (Key Performance Indicators) include conversion rates, customer acquisition costs (CAC), return on ad spend (ROAS), engagement rates, and lead generation metrics. Each campaign may have its own set of goals, so understanding what you want to predict or measure is the first step to designing an effective dashboard.
2. Collect Relevant Data:
Once you’ve identified the KPIs that matter to your business, you’ll need to gather the necessary data. This data may come from multiple sources, such as your CRM, Google Analytics, social media platforms, email marketing tools, and paid advertising platforms like Google Ads and Facebook Ads. You’ll need to integrate all of these data sources to get a holistic view of your campaigns. Consider using tools like Zapier or Integromat to automate the data flow into your dashboard.
3. Choose the Right Forecasting Model:
There are several forecasting models to choose from depending on the complexity of your data. Time-series analysis, regression analysis, and machine learning models like decision trees or neural networks are commonly used in marketing forecasting. If you’re just starting, a basic linear regression model might be sufficient, but as your campaign complexity grows, machine learning models can provide more accurate predictions. Tools like Google Analytics, Tableau, or Power BI offer built-in predictive analytics features to simplify this process.
4. Design the Dashboard Layout:
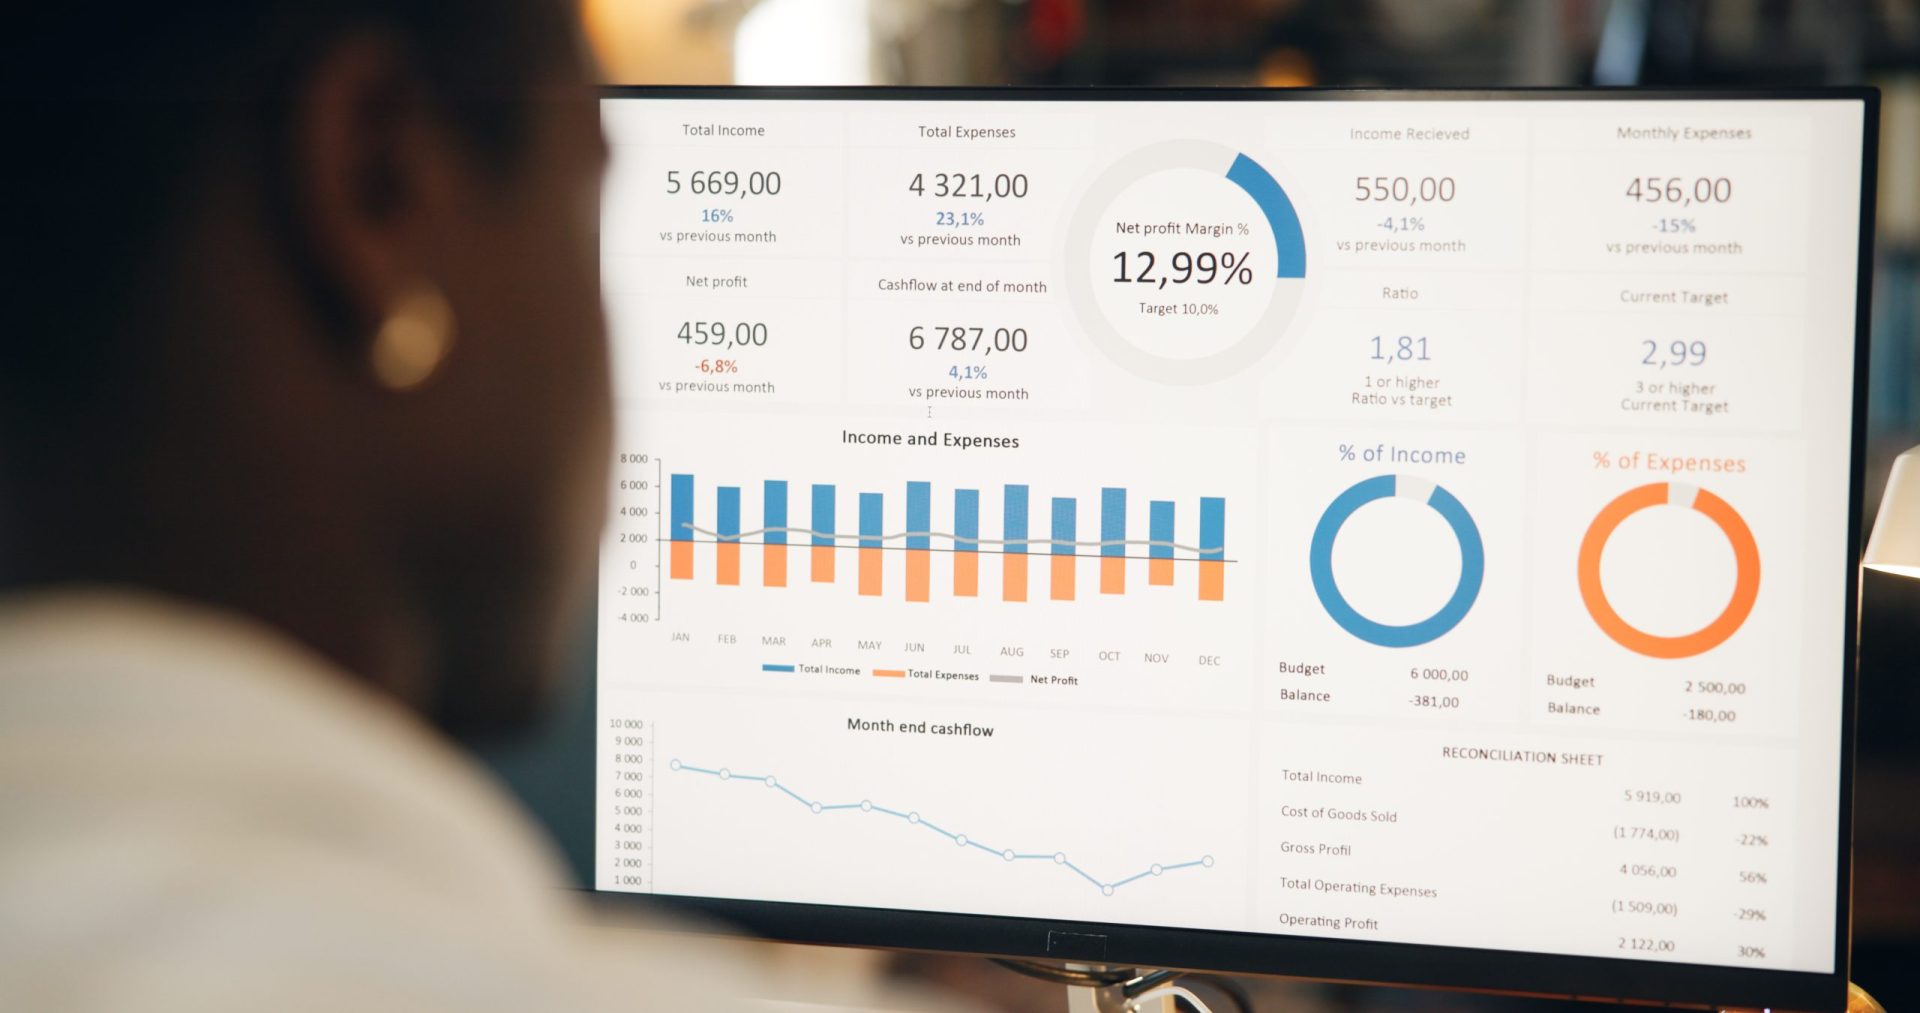
Now that you have your data and forecasting model, it’s time to design the layout of your dashboard. A good forecasting dashboard should be easy to read and navigate. It should offer a balance between real-time performance metrics and predicted outcomes. Make sure that your dashboard includes:
-
A summary section at the top for quick insights.
-
Visualizations like line graphs, bar charts, and scatter plots for performance trends.
-
Forecasted data that can be compared against actual performance.
-
Alerts for when your forecast deviates significantly from actual results.
Keep the design clean and uncluttered, with clearly labeled data points and well-chosen colors for differentiation.
5. Utilize Predictive Analytics:
The core function of a forecasting dashboard is to use predictive analytics to anticipate the future performance of your campaigns. Predictive analytics uses historical data to identify patterns and make forecasts about future outcomes. For example, by examining past customer behavior, a forecasting dashboard can predict which audience segments are likely to convert, allowing you to allocate your budget more effectively. Implement machine learning algorithms to continually refine and improve your predictions based on new data.
6. Monitor and Adjust in Real-Time:
After building your dashboard, it’s essential to keep monitoring and adjusting your campaigns in real-time based on the data insights. The beauty of forecasting dashboards is that they offer immediate access to performance metrics and predictions, allowing you to optimize campaigns on the fly. This real-time capability ensures that you’re not waiting until the campaign is over to determine its success, giving you the opportunity to make data-driven decisions and adapt to changes as they happen.